Two capitals, two futures.
A harmonised SLEUTH-3r analysis of Nairobi and Abuja — reading three decades of satellite built-up records to show how two opposite decongestion strategies, Kenya’s satellite cities and Nigeria’s capital relocation, leave measurable fingerprints in a city’s growth, and project where each leads by 2050.
Two ways to relieve a capital — and no way to compare them.
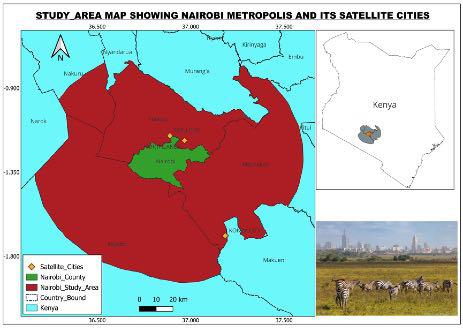
Across Sub-Saharan Africa, capital cities are absorbing people faster than they can be planned. Two governments answered the same pressure in opposite ways. Nigeria relocated its capital outright — building Abuja from scratch under a centralised master plan. Kenya kept Nairobi and tried to disperse it, steering growth into satellite towns under Vision 2030.
Both strategies are decades old, yet there was no spatially explicit, like-for-like evidence of what each actually does to a city's shape. GWO set out to measure it — running a single, harmonised urban-growth model over both cities so the only thing that differs is the city itself.
A city's growth has a signature. Read it carefully and the calibration coefficients stop being model parameters — they become a measure of how a place is governed.
One model, two cities, thirteen calibrations
The engine is SLEUTH-3r — a cellular-automata model in which urban growth emerges from five empirically calibrated coefficients: diffusion (spontaneous new development), breed (how readily new seeds take hold), spread (edge expansion), slope resistance and road gravity (how tightly growth follows roads). Calibrate those five against the historical record and each value becomes a quantitative fingerprint of how a city actually grew.
Every input was harmonised across both cities, so a coefficient difference can only mean a real difference in growth behaviour — never a difference in method. Thirteen sub-regional models (core, four road corridors, peri-urban ring per city) were each calibrated independently by three-stage brute-force search.
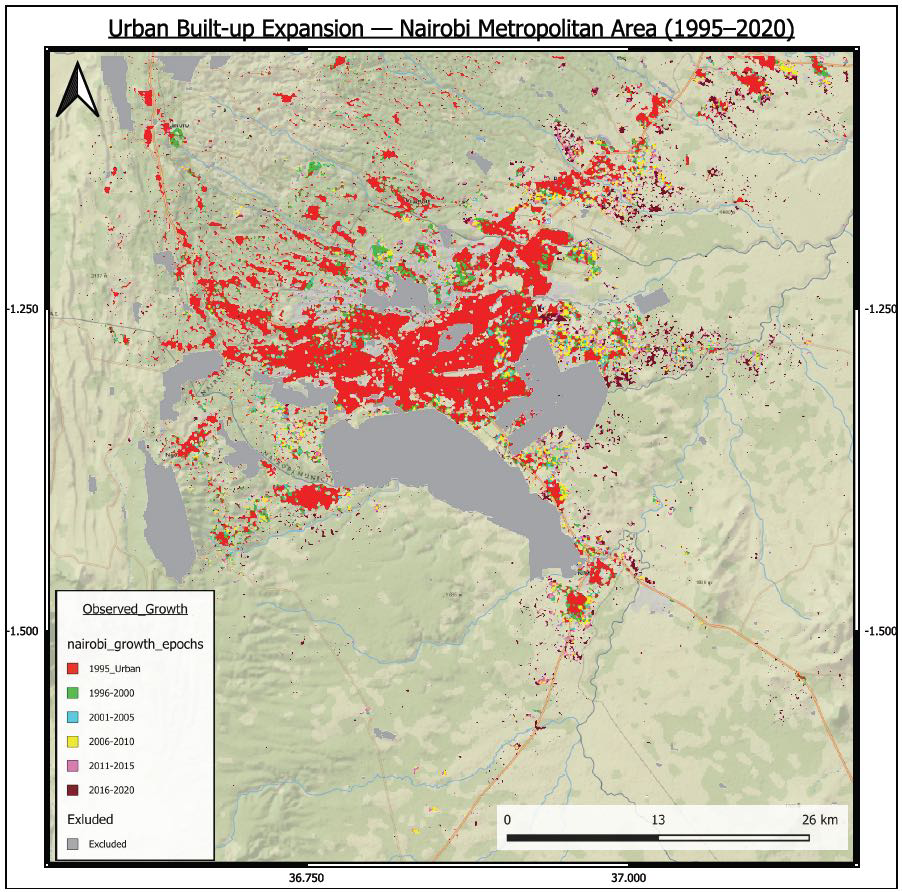
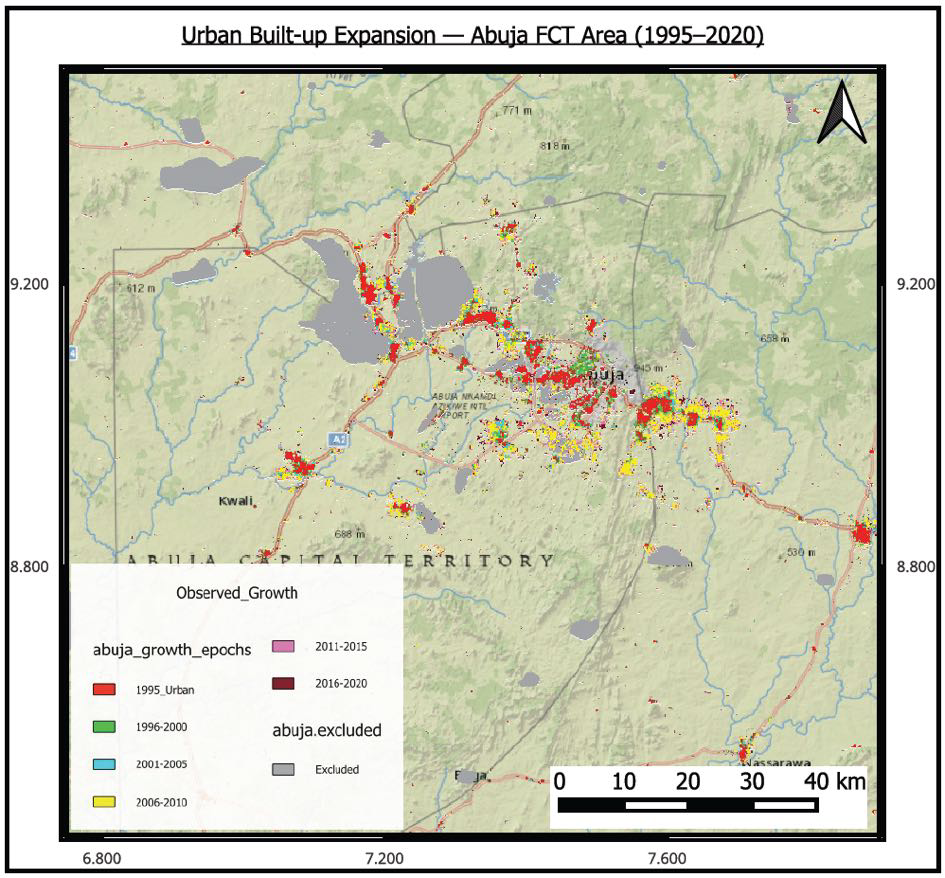
- GHS-BUILT-S R2023A 1995–2020
- Satellite-derived built-up surface at 30 m, six five-year epochs — the urban extent the model is calibrated to reproduce.
- OpenStreetMap road network transport layer
- Arterial and secondary roads, empirically weighted by logistic regression so road influence reflects observed growth, not arbitrary class weights.
- Terrain slope · DEM resistance layer
- Topographic denoising and 0–100 normalisation to constrain growth away from steep, non-buildable ground.
- SLEUTH-3r · brute-force calibration method
- Three narrowing stages with rising Monte Carlo counts, scored by the Optimal SLEUTH Metric and the Lee-Sallee spatial-overlap index.
What the models revealed
The two cities calibrate to structurally different growth regimes — and those regimes track their governance, not chance. Six numbers carry the result.
Finding 1 — the same pressure, two different shapes
Over 1995–2020 both cities grew hard, but differently. Nairobi expanded from 314 to 535 km² (+70%), accreting as an increasingly fragmented web: patch count rose 75% and its compactness index fell steadily, the signature of dispersed, leapfrog peri-urban growth. Abuja exploded from 179 to 635 km² (+254%) — peaking in 2005–2010 with the largest single growth episode in the dataset (+192 km² in five years) as capital relocation accelerated — yet stayed markedly more compact, with lower patch and edge density throughout.
| City | 1995 (km²) | 2020 (km²) | Change | Avg. rate |
|---|---|---|---|---|
| Nairobi | 314.0 | 534.9 | +70.4% | 8.8 km²/yr |
| Abuja | 179.4 | 635.4 | +254.2% | 18.2 km²/yr |
Source: GHS-BUILT-S R2023A, 30 m resolution, whole-area modelling units.
Finding 2 — the coefficients are a governance fingerprint
This is the core result. At the whole-area scale the two cities calibrate to almost opposite regimes. Nairobi returns high diffusion (59) with variable road gravity — spontaneous, weakly road-anchored sprawl under fragmented land tenure. Abuja returns near-zero diffusion (1) and breed (5) with road gravity of 89 — growth channelled along planned corridors with little spontaneous dispersal. At subregion level the contrast sharpens: Abuja's east corridor hits road gravity 99 (the strongest infrastructure-led signal in the study), while Nairobi's west corridor shows the highest diffusion (93).
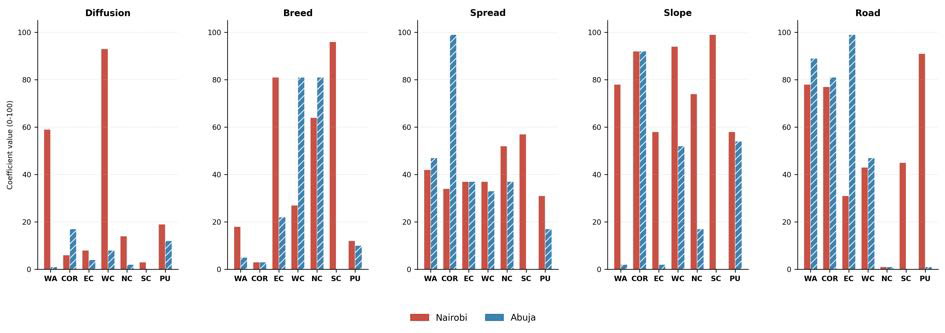
| Coefficient | Nairobi | Abuja | Reads as |
|---|---|---|---|
| Diffusion | 59 | 1 | Spontaneous dispersal |
| Breed | 18 | 5 | New-seed nucleation |
| Spread | 42 | 47 | Edge expansion |
| Road gravity | 78 | 89 | Corridor anchoring |
Coefficients range 0–100; best-fit by Optimal SLEUTH Metric at final calibration stage.
Finding 3 — the model holds up against withheld data
Trust in any projection rests on validation. Calibrating on 1995–2015 only and predicting the withheld 2020 extent, 11 of 13 subregions land within ±10% pixel difference — an 84.6% pass rate, strong for SLEUTH in an African urban context. The two misses are diagnostic, not random: Nairobi's peri-urban ring (under-predicted) is exactly where rapid informal settlement defies any rules-based model, and Abuja's whole-area unit (over-predicted) reflects the model extending growth along corridors slightly faster than reality.
| Unit | Obs. (km²) | Sim. (km²) | PFD | Lee-Sallee |
|---|---|---|---|---|
| Nairobi · whole area | 534.9 | 529.5 | −1.0% | 0.663 |
| Nairobi · core | 165.8 | 170.5 | +2.8% | 0.826 |
| Abuja · whole area | 635.4 | 700.0 | +10.2% | 0.514 |
| Abuja · west corridor | 192.1 | 191.7 | −0.2% | 0.482 |
PFD = pixel fractional difference; Lee-Sallee = spatial overlap (1.0 = perfect). 11/13 subregions within ±10%.
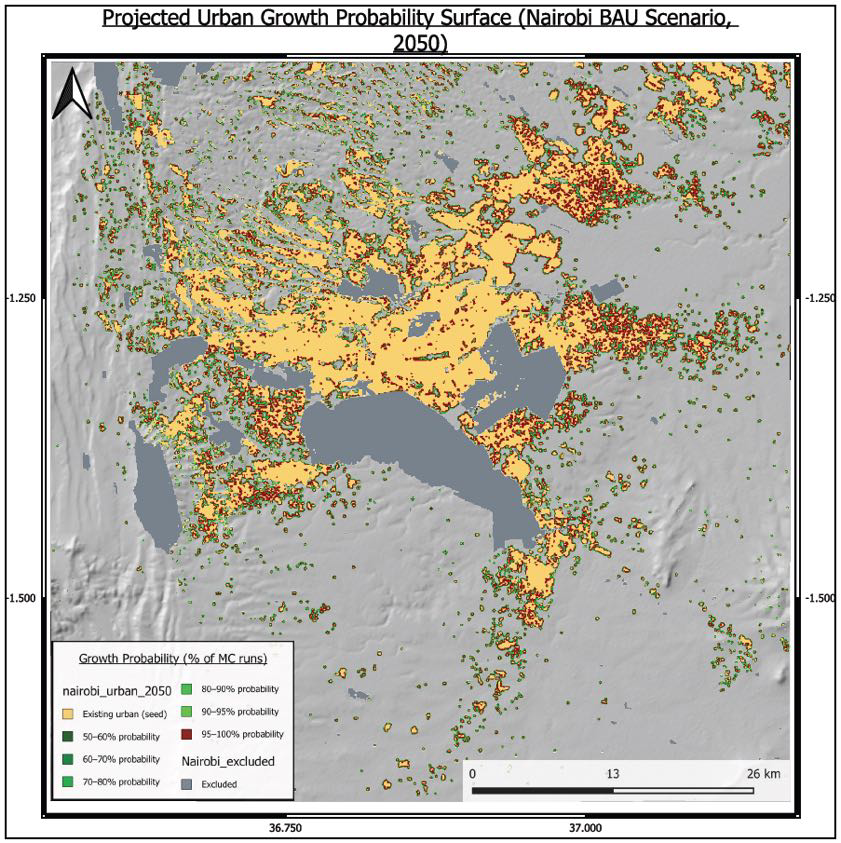
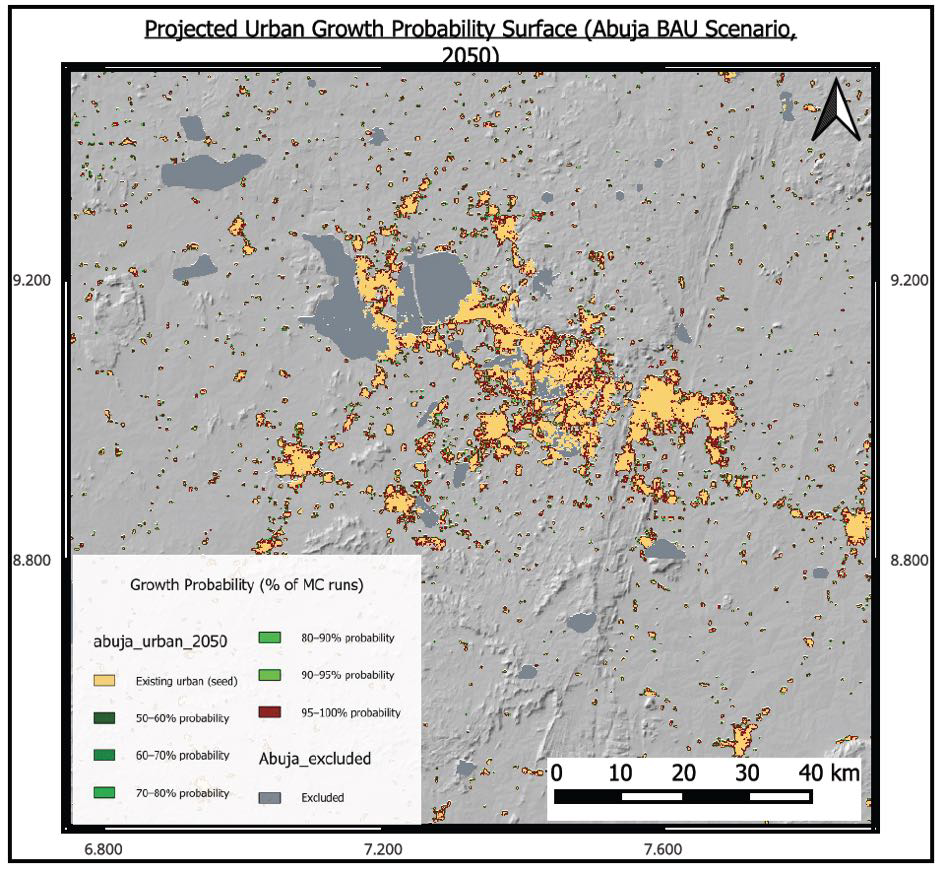
Finding 4 — two divergent futures, projected to 2050
Holding each city's calibrated regime constant and projecting forward, both roughly double by 2050 — Nairobi to 1,213 km² (+127%) and Abuja to 1,766 km² (+178%). But the form diverges sharply. Nairobi's probability surface scatters high-growth pixels across the eastern and northern fringe — dispersed, fragmenting, expensive to service. Abuja's stays contained around its core and arterial spines — denser, corridor-bound. Same model, same horizon; the institutional signature decides the shape.
| City | 2020 | 2030 | 2040 | 2050 | Change |
|---|---|---|---|---|---|
| Nairobi | 534.9 | 683.7 | 907.9 | 1,213.2 | +126.8% |
| Abuja | 635.4 | 912.8 | 1,302.2 | 1,765.6 | +177.9% |
Area in km². SLEUTH-3r BAU prediction, 100 Monte Carlo iterations, base year 2020.
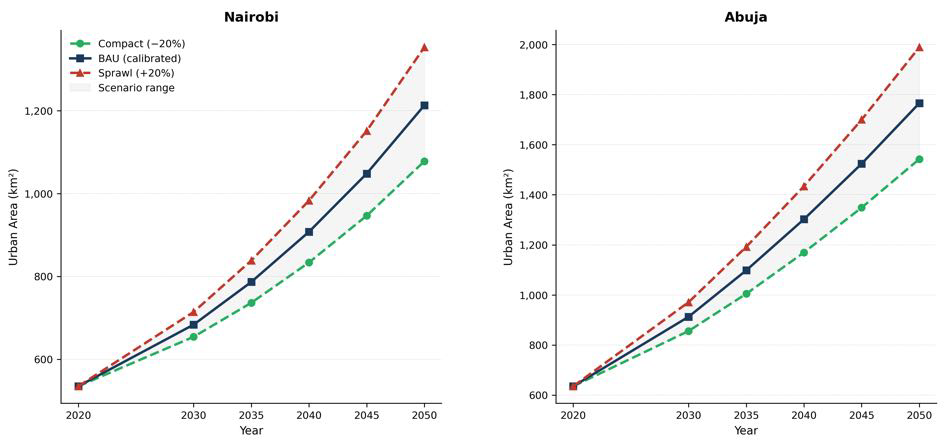
How sensitive are those futures?
Projections are scenarios, not prophecies — so we stress-tested them. Perturbing the breed and spread coefficients ±20% (a Compact and a Sprawl scenario around BAU) moves the 2050 footprint by ±11–13%: roughly ±135 km² for Nairobi and ±223 km² for Abuja. The divergence compounds over time, widening from tens of km² in 2030 to hundreds by 2050 — which is precisely where planning choices made now have the most leverage.
Why a growth signature matters
Treating SLEUTH coefficients as governance proxies turns an abstract model into a planning instrument. Because each city's growth logic is quantified — and validated against real data — the projections answer the practical questions planners, lenders and infrastructure agencies actually ask.
Infrastructure sequencing
Knowing whether growth follows roads (Abuja) or leaps ahead of them (Nairobi) tells agencies whether to lead with arterials or with trunk services to the fringe.
Servicing-cost forecasting
Dispersed, fragmenting growth costs far more per capita to service. The fragmentation metrics quantify that premium a decade ahead.
Land & tenure reform
High diffusion under fragmented tenure is now measurable — giving land-governance reform a concrete spatial target rather than a slogan.
Green-belt & exclusion design
The probability surfaces show exactly where 2050 growth will press against parks, wetlands and watersheds — before the conflict happens.
Satellite-city siting
Abuja's anomalous north corridor (high breed, zero road gravity) flags emerging informal growth beyond the master plan — a siting early-warning.
Cross-city policy transfer
A harmonised framework lets one city's strategy be tested against another's data — turning anecdote into evidence for regional planning.
The recommendation: calibrate the city, then plan it
The evidence points to one operating principle — a city's growth should be calibrated from its own satellite record before any long-range plan is drawn, and re-calibrated as new imagery arrives. GWO's recommendations build that into a repeatable capability.
- 01
Living calibration
Re-fit each city's coefficients on a rolling basis as new GHS-BUILT-S epochs land, so the growth signature stays current.
- 02
Scenario dashboards
Turn the probability surfaces into planner-facing layers — Compact / BAU / Sprawl — overlaid on infrastructure and exclusion zones.
- 03
Corridor-level monitoring
Track the subregion coefficients that flag governance stress — like Abuja's north corridor — as informal-growth early warnings.
- 04
Transferable framework
Apply the same harmonised pipeline to other fast-growing capitals, building a comparable evidence base across the region.
The same method — harmonised, validated, calibration-as-evidence — extends to any rapidly urbanising region, turning a one-off thesis into a transferable planning service.
Sources & data
This case study condenses independent research applying a harmonised SLEUTH-3r cellular-automata framework to GHS-BUILT-S satellite built-up records, OpenStreetMap road networks and terrain data. For full methods, datasets and references, please get in touch.
Need to read the growth ahead of you?
If your decisions depend on where a city, coastline or landscape is actually headed, we turn satellite records into calibrated, validated projections you can plan and defend against.